Using broadcasting instead of for loops.
Python source code: plot_broadcasting.py
from __future__ import division
import numpy as np
from matplotlib import pyplot as mp
NDETECTORS = 8
NSAMPLES = 1000
SAMPLING_PERIOD = 0.1
GLITCH_TAU = 0.3
GLITCH_AMPL = 20
GAIN_SIGMA = 0.03
SOURCE_AMPL = 7
SOURCE_PERIOD = 10
NOISE_SIGMA = 0.7
time = np.arange(NSAMPLES) * SAMPLING_PERIOD
glitch = np.zeros(NSAMPLES)
glitch[100:] = GLITCH_AMPL * np.exp(-time[:-100] / GLITCH_TAU)
gain = 1 + GAIN_SIGMA * np.random.standard_normal(NDETECTORS)
offset = np.arange(NDETECTORS)
source = SOURCE_AMPL * np.sin(2 * np.pi * time / SOURCE_PERIOD)
noise = NOISE_SIGMA * np.random.standard_normal((NDETECTORS, NSAMPLES))
signal = gain[:, None] * source + glitch + offset[:, None] + noise
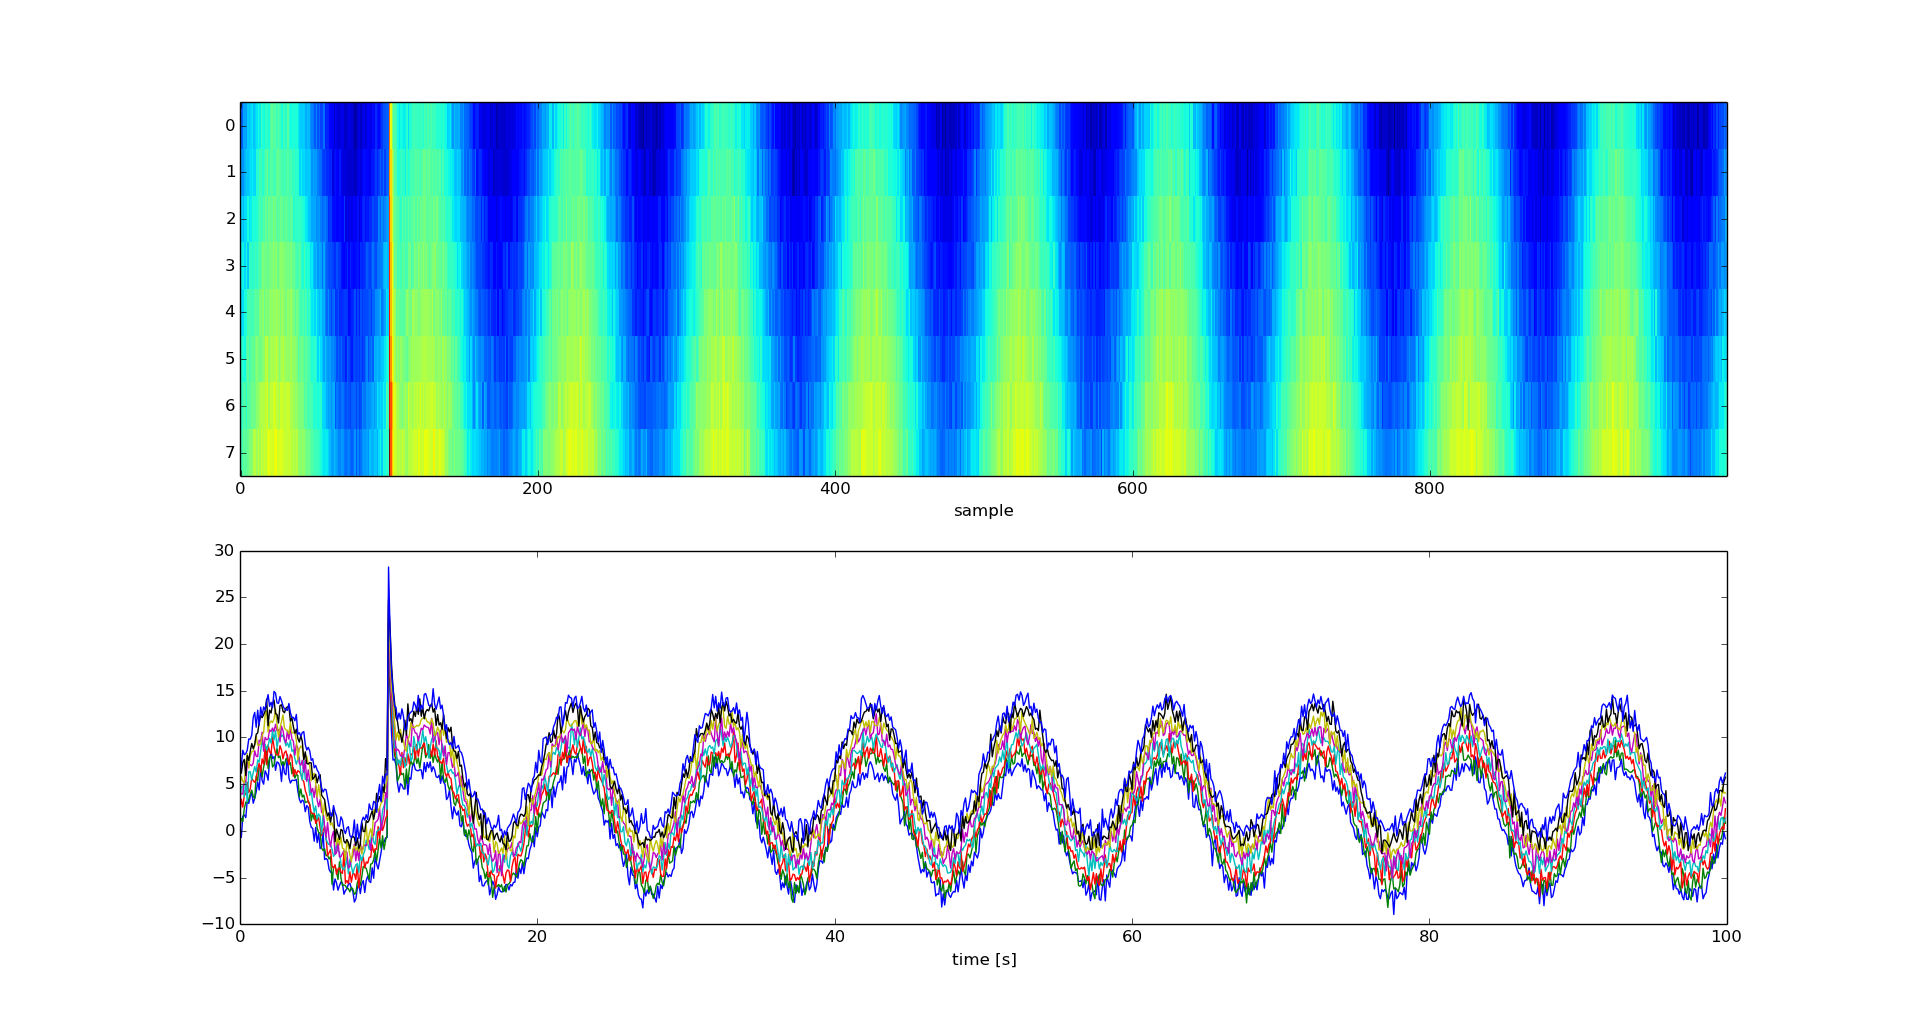
mp.figure()
mp.subplot('211')
mp.imshow(signal, aspect='auto', interpolation='none')
mp.xlabel('sample')
mp.subplot('212')
for s in signal:
mp.plot(time, s)
mp.xlabel('time [s]')
mp.ylabel('signal')
mp.show()